New Brunswick, USA, 2005
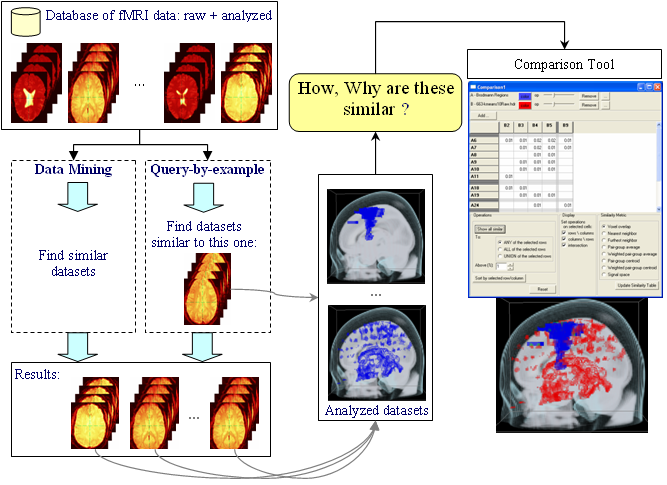
fMRI is an imaging technique that is used to understand brain functionality. Scans are taken at intervals as a patient performs some mental tasks, resulting in hundreds of datasets. It is an increasingly popular technique in fields ranging from medicine, psychology or even marketing and economics. However, these images tend to be noisy and new packages are constantly being developed to analyze and filter these large datasets. Because of the large data size and many analysis parameters, comparisons between results or between experiments are difficult. We present a visualization tool that allows interactive comparison of different analyzed datasets. Such analyzed datasets can be results of different analytic methods used in fMRI analysis, on data from one or more subjects and/or one or more experiments. We treat every analysis result as a functional clustering of voxels mapped into brain space and employ visualization techniques to allow the user to interactively explore the similarity and differences between the different datasets. This can provide valuable insight into the data or the analysis methodologies being studied. Thus, the tool can be used as a visualization interface of a data mining engine and could also support a "query-by-example" approach to fMRI data retrieval.
- Software: CCVT (Windows Installer)
- User Manual [PDF]
- Master Thesis [PDF] - describes the tool in detail.
- Master Thesis + User Manual in one document [PDF]
Screeshots:

Comparing the result of several different analysis methodologies applied to the same dataset.
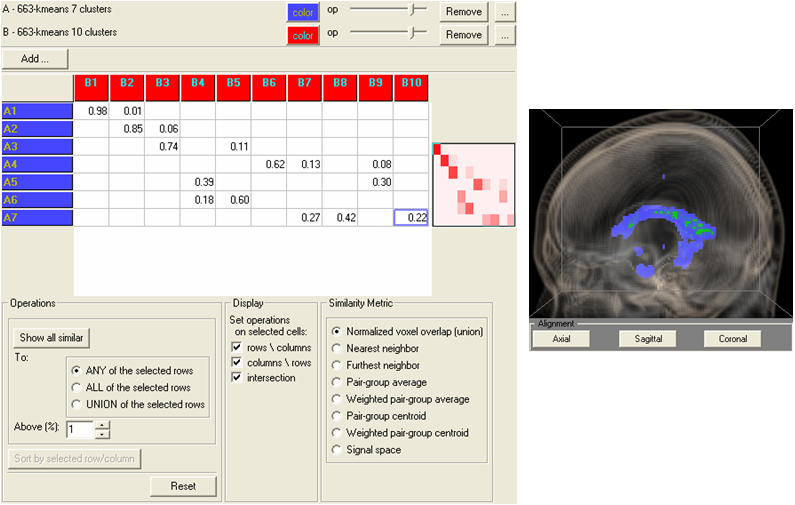
Comparing the results of using different parameters of an analysis algorithm (k-means).

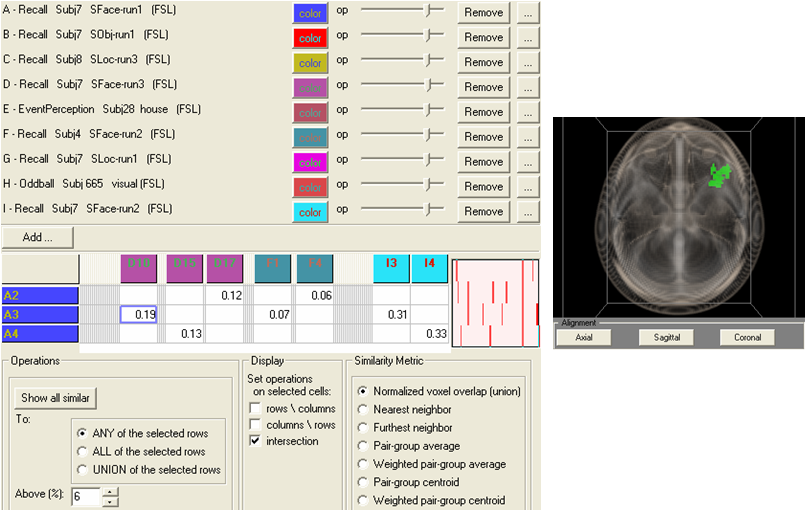
Identifying common activations in multiple subjects of the same experiment.
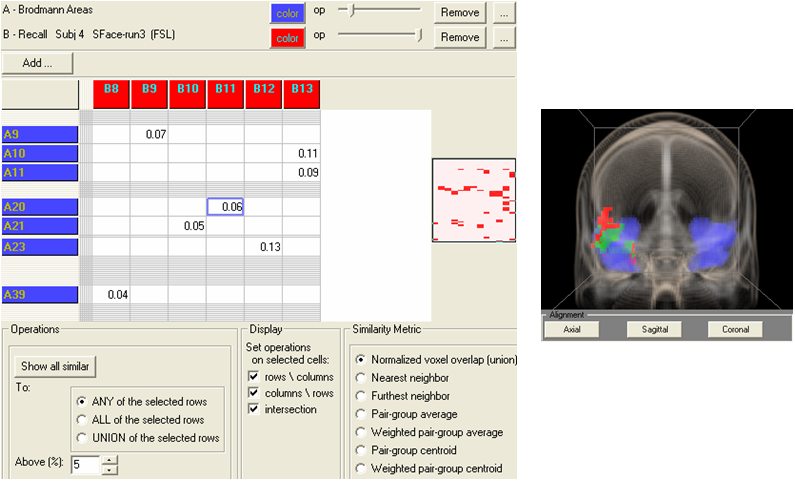
Brodmann Area mapping
"Query-by-example" data retrieval
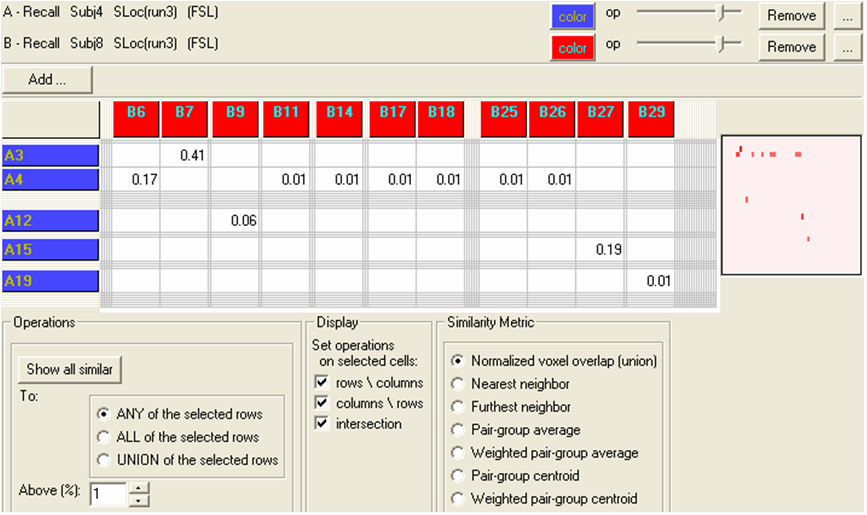
Investigating similarity reported by other methods (Brodmann Vector similarity)
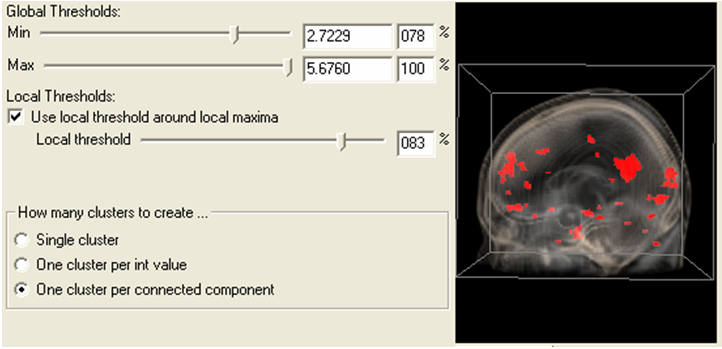
Setting thresholds on parametric maps.
| Downloads | Screenshots |
| Nicu D. Cornea: cornea@caip.rutgers.edu | Jul 13, 2005 |